
Other recent blogs


Summery:- Key stat: By 2026, 85% of organisations will use some form of generative AI for observability — up from less than 20% in 2024 (Gartner). For teams deploying AI today, observability is no longer optional.
Enterprises deploying AI systems face a critical blind spot: traditional monitoring tools were never built for the unpredictable, probabilistic nature of large language models (LLMs) and generative AI. A model can return subtly wrong outputs, drift quietly over time, or inflate token costs — all without triggering a single alert in a conventional monitoring stack.
Generative AI observability closes this gap. It gives engineering and data teams a comprehensive view of how AI systems behave in production — from latency and error rates to hallucination frequency and data lineage — enabling proactive resolution before users are impacted.
In this guide, we decode what generative AI observability is, how it differs from traditional monitoring, what its four key pillars are, which tools support it, and what challenges organisations face implementing it in 2025.
Moreover, the result of AI observability helps optimize performance in complex systems. It enables companies to analyze specific trends and patterns in observability data much earlier. correctness, reliability, and effectiveness are the key benefits of using Generative AI to transform observability. Also, it makes the journey of dealing with the complexities of modern systems relatively smooth by allowing organizations to make data-driven decisions.
What Is Generative AI Observability?
AI observability, more broadly, is the practice of gaining full visibility into how any AI or machine learning system behaves in production — including its inputs, outputs, performance metrics, and decision patterns — so teams can detect issues, explain model behaviour, and maintain reliability at scale.
Generative AI observability is an organisation's capability to monitor, understand, and proactively improve the internal behaviour of AI-driven systems — particularly those powered by large language models (LLMs) — by analysing external outputs, performance signals, and operational patterns.
Unlike traditional monitoring, which watches for known failure thresholds, AI observability is designed to surface unknown unknowns: the subtle drifts, hallucinations, latency spikes, and data quality issues that standard monitoring tools are blind to.
In short: monitoring tells you what broke. Observability tells you why it broke — and helps you prevent it from happening again.
When applied to LLMs and generative AI, observability enables teams to:
- Track model outputs for accuracy, consistency, and safety
- Detect hallucinations and off-policy responses in real time
- Monitor token consumption and cost efficiency across API calls
- Trace multi-step AI agent workflows end-to-end
- Identify performance degradation before it reaches end users
AI Observability vs Traditional Monitoring: Key Differences
Observability and monitoring are closely related but serve fundamentally different purposes. As AI systems grow more complex, understanding this distinction has become essential for data engineering and DevOps teams.
| Feature | Traditional Monitoring | AI Observability |
|---|---|---|
| Approach | Reactive — alerts after failure | Proactive — predicts before failure |
| Scope | Predefined metrics & thresholds | Open-ended, unknown-unknown detection |
| Data types | Metrics & logs | Metrics, logs, traces, metadata, lineage |
| AI/LLM support | Not designed for probabilistic models | Built for LLM outputs, hallucinations, token usage |
| Root cause | Identifies what broke | Identifies why it broke & patterns |
| Adaptability | Static rules | Dynamic ML-driven pattern learning |
| Best for | Infrastructure health | Complex AI-driven distributed systems |
The most important distinction: monitoring works when you know what to look for. Observability is what you need when you don't — which is exactly the situation with non-deterministic AI systems.
Monitoring Components:
- Data collection agents reside on individual servers, containers, or services. They are responsible for collecting metrics, logs, traces, and event datasets from the underlying systems and applications.
- Data storage and aggregation are important steps in the entire journey of reshaping Observability and improving system performance. Monitoring systems are programmed to store the collected data in databases or time-series databases. This data is utilized for analysis and visualization after the datasets are preprocessed, and companies use the data to facilitate efficient querying and analysis.
- Alerting and notification are the major benefits of using monitoring tools in sync with Observability platforms. Powered by alerting mechanisms, the duo helps stakeholders detect predefined thresholds, anomalies, or critical events early. As a result of alerts, the respective teams are able to proactively respond to issues and prevent service disruptions on time.
- Visualization and analysis in monitoring dashboards and visualization tools are absolute game-changers in reflecting the collected data in a comprehensible format using graphs, charts, and heatmaps. Analysis features enable data engineer teams to explore trends, correlations, and anomalies within the data. This in turn acts as a critical bridge, making observability datasets more understandable and actionable.
Four Golden Signals:
- Latency measures the time it takes for a system to respond to a request or execute an operation. Monitoring latency helps identify performance bottlenecks, optimize resource utilization, and ensure responsive user experiences.
- Traffic: Traffic metrics track the volume of requests or transactions processed by a system over time. Monitoring traffic helps teams understand usage patterns, forecast capacity requirements, and detect sudden spikes or drops in demand.
- Errors: Error rates indicate the frequency of failed or erroneous requests encountered by a system. Monitoring errors helps identify bugs, infrastructure issues, or external dependencies causing failures, enabling timely resolution and improving system reliability.
- Saturation: Saturation measures the utilization of critical system resources, such as CPU, memory, disk, or network bandwidth. Monitoring saturation levels helps anticipate resource exhaustion, prevent performance degradation, and scale infrastructure proactively.

Monitoring enables intelligent observability when powered by Generative AI. On the other hand, Generative AI observability involves tracking factors such as data distribution, model loss, convergence patterns, and the quality of generated outputs. By having a comprehensive view of these aspects, stakeholders can make informed decisions, implement improvements, and ensure the model aligns with its intended objectives.
How to Get Started with Generative AI Observability: A 5-Step Roadmap
mplementing generative AI observability doesn't require an overhaul — it can be rolled out incrementally:
- Instrument with OpenTelemetry GenAI conventions — capture traces for every LLM call, including prompts, responses, and tool invocations.
- Define golden signals for LLM workloads — adapt latency, traffic, errors, and saturation to track token throughput, time-to-first-token, and request volume per model.
- Set up hallucination and quality scoring — use evaluation models to flag factually inconsistent or off-policy outputs in near real time.
- Implement cost and token dashboards — treat token spend as a first-class metric, not an afterthought, especially for agentic pipelines that make multiple chained calls.
- Establish alerting and feedback loops — route anomalies (drift, cost spikes, hallucination rate increases) to the teams that own the prompts, models, or retrieval pipelines so issues get fixed at the source.
What are the pillars of Generative AI Observability?
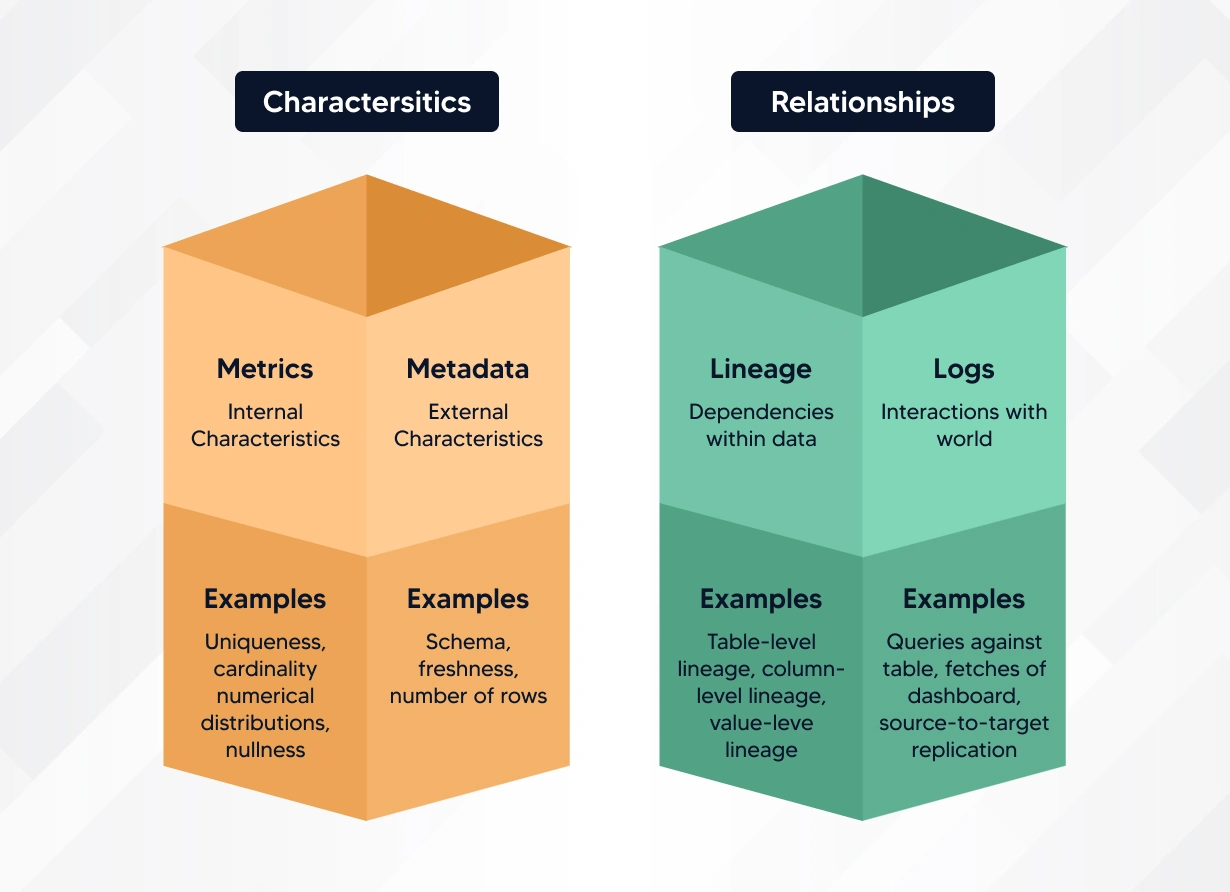
Artificial intelligence observability relies on four key pillars: metrics, logs, metadata, and lineage. These pillars provide a detailed framework that data engineers leverage to better understand, monitor, and manage complex systems. Let's examine each of these observability pillars in depth to gain a better understanding.
Metrics:
Metrics are quantitative measurements. They provide insights into how a system performs and behaves. These can include key performance indicators (KPIs) such as response times, error rates, and resource use. Using the metrics, one can get a high-level view of system health and performance. The metrics are also beneficial to quickly see trends, anomalies, or potential issues.
Logs:
Logs are detailed records of events and activities within a system, showcasing how and when things happened. They provide a chronological and granular view of what has occurred, offering valuable context during troubleshooting and debugging. With Logs, one can capture a wide range of information, including error messages, user interactions, and system events. Companies analyze logs to find the root causes of issues and understand the sequence of events leading to a state.
Metadata:
Metadata refers to extra information. It gives context and understanding to metrics and logs. Metadata includes details about the environment, configuration, and relationships between components. Also, it bridges the gap between raw data and insights, providing a deeper view of the system's context. Usually, metadata provide detailed information on software versions, dependencies or configurations, which play a crucial role in influencing system behavior.
Lineage:
Lineage involves tracing the data flow via a system and creates a connections between different components. It clarifies how data changes as it moves through the system. This is especially true in complex environments, where data undergoes many changes or passes through various stages. Companies tracking lineage are able to identify bottlenecks early. This results in improving data integrity, and the overall efficiency of a system.
These four pillars create strong observability. They give a full view of a system's inner workings. Here's how these pillars work in concert:
How Generative AI is reshaping Observability platforms?
Generative AI is not just a subject of observability — it is actively reshaping how observability platforms work. By applying LLMs and generative models to the practice of monitoring itself, platforms are unlocking capabilities that traditional rule-based tools cannot match.
Enhanced anomaly detection through pattern learning
Generative AI models — particularly those based on generative adversarial networks (GANs) or variational autoencoders (VAEs) — are trained on vast datasets of normal system behaviour. They learn the complex distributions in performance data and can detect subtle deviations from learned baselines, rather than relying on static thresholds.
This is transformative for LLM applications, where 'normal' behaviour varies enormously depending on prompt, context, and user. Generative models adapt dynamically, maintaining effective anomaly detection even as system behaviour evolves.
Predictive intelligence and proactive problem solving
Generative AI enables observability platforms to shift from reactive alerting to predictive intelligence. By identifying patterns in historical data, these platforms can forecast potential failures — token budget exhaustion, latency degradation, hallucination rate increases — before they impact users.
According to a 2025 New Relic survey, AI monitoring capabilities grew from 42% adoption in 2024 to 54% in 2025, driven largely by this shift toward predictive observability.
Root cause analysis at speed and scale
Identifying the root cause of failures in distributed AI systems — especially multi-model agentic pipelines — is notoriously difficult with traditional tools. Generative AI can analyse vast telemetry datasets, uncover intricate dependencies between components, and surface the likely root cause within seconds.
Real-time synthetic data for testing and validation
Generative AI can create realistic synthetic data for testing observability pipelines under simulated load conditions. This allows teams to validate monitoring configurations and stress-test alerting systems without waiting for real production failures.
Natural language interfaces for observability
Emerging observability platforms now use LLMs to enable natural language querying of telemetry data — allowing engineers to ask 'Why did latency spike at 2 PM?' and receive a contextual, human-readable explanation rather than raw log data. This democratises observability access across teams without deep DevOps expertise.
Navigate performance bottlenecks with intelligent Generative AI Observability solutions.
Let's talkTop Generative AI Observability Tools and Platforms
As AI observability matures, a rich ecosystem of tools has emerged — from open-source instrumentation frameworks to commercial LLM-native platforms. Here are the leading options teams are deploying in 2025:
| Tool | Pricing | Best for |
|---|---|---|
| OpenTelemetry | Open-source | Universal instrumentation standard for traces, metrics, logs. Native GenAI semantic conventions added in 2024. |
| Datadog LLM Observability | Commercial | End-to-end LLM pipeline tracing, hallucination detection, token cost tracking, and prompt/response monitoring. |
| LangSmith | Commercial/Free tier | Native tracing for LangChain apps. Captures prompt chains, agent steps, latency, and evaluation scores. |
| Arize AI | Commercial | ML model monitoring with LLM-specific evaluation — drift, hallucination scoring, and embedding visualisation. |
| Helicone | Open-source/Commercial | LLM proxy layer with built-in logging, cost analytics, caching, and rate-limit monitoring for OpenAI, Anthropic, etc. |
| Weights & Biases | Commercial/Free tier | Experiment tracking and LLM monitoring. Strong for teams fine-tuning or evaluating models at scale. |
The right tool depends on your stack. Teams using LangChain or LlamaIndex typically start with LangSmith. Teams with existing Datadog infrastructure extend it with LLM Observability. Organisations prioritising vendor-neutrality and open standards use OpenTelemetry as their instrumentation backbone and layer purpose-built tools on top.
Generative AI Observability Challenges
Despite rapid advances, implementing effective AI observability in production remains difficult. Teams face a distinct set of challenges that don't exist in traditional software monitoring:
- Challenge 1: Hallucination detection at scale — scoring model outputs for factual accuracy in real time requires dedicated evaluation models, adding latency and cost.
- Challenge 2: Agentic AI pipeline tracing — multi-step agent workflows (where one LLM calls tools, APIs, or other models) create deeply nested traces that standard APM tools were not designed to handle.
- Challenge 3: Token cost management — as LLM API usage scales, token costs become a critical operational metric. Most observability tools treat cost as an afterthought rather than a first-class signal.
- Challenge 4: Data privacy in telemetry — sending prompts and model responses to external observability platforms raises significant PII and confidentiality concerns, cited as the top concern by 61% of organisations in a 2026 Elastic survey.
- Challenge 5: Hallucination vs. confabulation distinction — not all incorrect outputs are equal. Observability frameworks are still developing nuanced taxonomies to distinguish types of model error for meaningful alerting.
Key Takeaways: When to Implement Generative AI Observability
Generative AI observability should be treated as a production requirement, not a post-deployment concern. Here is when to prioritise it:
- When you are deploying LLMs to end users — any model generating real responses in production needs hallucination and safety monitoring from day one.
- When you are running multi-model or agentic pipelines — the complexity of chained AI workflows makes root-cause analysis impossible without trace-level observability.
- When token API costs are a business concern — without cost monitoring, LLM spending scales faster than value, especially as request volumes grow.
- When regulatory or compliance requirements apply — financial, healthcare, and government sectors need audit trails of AI decisions, which observability lineage tracking provides.
- When model performance needs to be maintained over time — LLMs drift as prompts evolve, retrieval data changes, and user behaviour shifts. Continuous observability catches this drift before it affects outcomes.
The final thoughts:
Generative AI observability has an important role to play in improving system performance by bringing ethical considerations to the forefront. Applying responsible AI practices become integral to observability solutions as they ensure that generative models align with ethical standards and avoid biases or unintended consequences.
Interestingly, at Kellton our experts deliver end-to-end intelligent Generative AI observability solutions that are engineered particularly to deliver greater intelligence, adaptability, and creativity. Our solutions facilitate seamless synergy unlocking new possibilities for effective monitoring at the intersection of predictive insights, data synthesis, and dynamic adaptation to changes in complex systems.
We strongly believe Technology is advancing and Generative AI's impact on observability will likely redefine how we ensure AI-driven applications' reliability and performance.
Frequently Asked Questions: Generative AI Observability
Q1. What is generative AI observability?
Generative AI observability is the practice of monitoring, analysing, and understanding the internal behaviour of AI systems — particularly LLMs — using external signals like outputs, latency, token usage, and error patterns. It enables teams to detect and resolve issues before they affect users.
Q2. How is AI observability different from traditional monitoring?
Traditional monitoring is reactive and rule-based — it alerts you when known thresholds are breached. AI observability is proactive and adaptive — it detects unknown failures, understands why they happen, and can predict issues before they occur. Monitoring tells you what broke; observability tells you why.
Q3. What are the four pillars of generative AI observability?
The four pillars are: (1) Metrics — quantitative performance KPIs; (2) Logs — detailed event records; (3) Metadata — contextual environment data; and (4) Lineage — data flow tracing across the pipeline. Together they provide complete visibility into AI system behaviour.
Q4. What tools support LLM and generative AI observability?
Key tools include OpenTelemetry (open-source instrumentation standard), Datadog LLM Observability, LangSmith (LangChain's native tracing), Arize AI (model monitoring), Helicone (LLM proxy with analytics), and Weights & Biases (experiment tracking). Each targets different layers of the AI stack.
Q5. What are the biggest challenges in AI observability in 2026
The top challenges are: hallucination detection and scoring in LLM outputs; monitoring agentic AI workflows with multiple chained models; token cost management at scale; latency optimisation in multi-model pipelines; and ensuring data privacy when sending telemetry to external platforms.